
Have you ever looked at a graph and wondered whether it represents a function? That’s exactly where mathematicians use a simple but powerful tool — the vertical line test. When we explain what the vertical line test is and how it is used, we’re really talking about an easy method to determine if a graph follows the rules of a function.
This article breaks down the concept in plain language, shares examples, and even touches on the reasoning behind it. To make things more relatable, I’ll also list some guiding life values — because just like in math, clarity and consistency matter in everyday decisions too.
Some Personal Life Values A Human Perspective
Before diving into math, here are a few values that guide thoughtful problem-solving — in life and in learning:
- Curiosity – Asking “why” helps uncover deeper understanding.
- Clarity – Keeping ideas simple makes them easier to apply.
- Consistency – Following rules (like functions do) prevents confusion.
- Honesty – Being accurate matters, especially in math.
- Growth mindset – Mistakes are stepping stones to improvement.
These values actually connect to how we analyze graphs — we look for consistent, clear relationships.
What Is the Vertical Line Test? Definition
When we explain what the vertical line test is and how it is used, the definition is straightforward:
The vertical line test is a method used to determine whether a graph represents a function.
The Rule
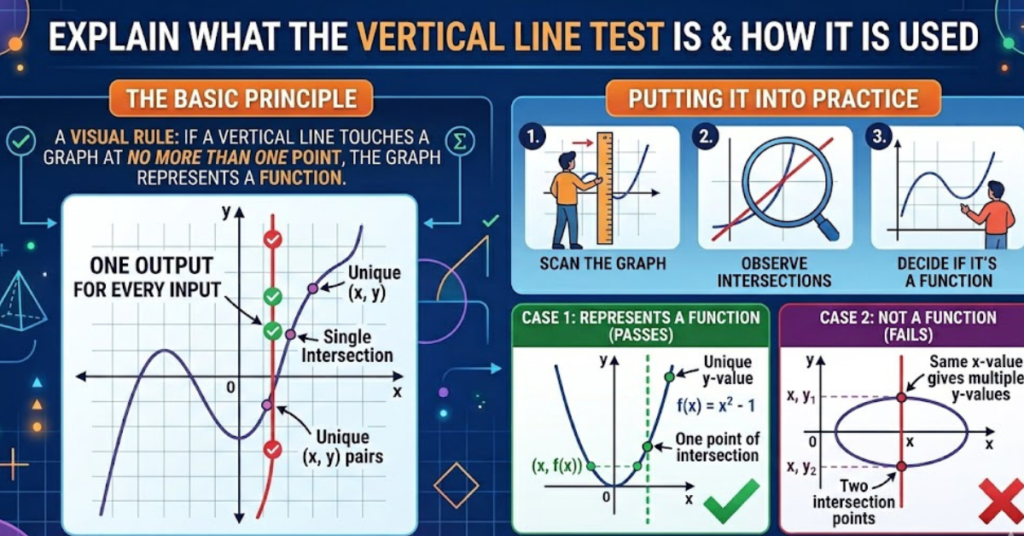
A graph passes the vertical line test if no vertical line intersects the graph more than once.
- If a vertical line touches the graph at one point → it is a function
- If a vertical line touches the graph at multiple points → it is NOT a function
Why? Because in a function, each input (x-value) can only have one output (y-value).
Why the Vertical Line Test Works
Functions follow a simple rule:
Every x-value must correspond to exactly one y-value.
A vertical line represents a single x-value. If that line crosses the graph multiple times, it means:
- One input
- Multiple outputs
- Not a function
This makes the test quick and visual — no calculations required.
How the Vertical Line Test Is Used (Step-by-Step)
Here’s how to apply the test in practice:
Step 1: Look at the graph
Identify the curve, line, or shape.
Step 2: Imagine vertical lines
Mentally draw straight lines going up and down across the graph.
Step 3: Check intersections
Ask:
- Does any vertical line hit more than once?
Step 4: Decide
- One intersection per line → Function
- More than one → Not a function
Examples of the Vertical Line Test
Example 1: Straight Line (Function)
A simple line like:
Every vertical line hits once → Passes test
Example 2: Circle (Not a Function)
A circle graph:
Some vertical lines hit twice → Fails test
Example 3: Parabola (Function)
Each vertical line intersects once → Function
Common Mistakes When Using the Vertical Line Test
People often get confused by:
- Tilting the line (must be vertical only)
- Checking only one part of the graph
- Forgetting that touching twice means failure
- Confusing vertical with horizontal line test
Vertical Line Test vs Horizontal Line Test
These two are different but related:
| Test | Purpose |
| Vertical Line Test | Determines if graph is a function |
| Horizontal Line Test | Determines if function is one-to-one |
Remember: vertical checks input consistency, horizontal checks output uniqueness.
Real-Life Applications
Understanding functions is important in:
- Physics graphs
- Economics models
- Computer programming
- Engineering designs
- Data analysis
The vertical line test helps quickly verify valid relationships.
Key Takeaways
- The vertical line test checks if a graph is a function
- Draw imaginary vertical lines
- If any line intersects more than once → not a function
- Each input must map to one output
- It’s fast, visual, and widely used
FAQs
What is the vertical line tests in simple words?
The vertical line test is a way to check if a graph represents a function by seeing whether any vertical line crosses the graph more than once.
Why does the vertical line tests work?
It works because functions allow only one output for each input, and a vertical line represents a single input value.
Can a graph fail the vertical line test?
Yes. Shapes like circles and sideways parabolas fail because some x-values have multiple y-values.
Is the vertical line test always accurate?
Yes, for determining whether a relation is a function in graph form.
What is an example of a graph that fails the test?
A circle fails because vertical lines intersect it at two points.
Conclusion
Understanding how to explain what the vertical line tests is and how it is used makes identifying functions much easier. It’s a simple visual tool that saves time and prevents mistakes. Just remember: one vertical line, one intersection.
Whether you’re studying algebra, preparing for exams, or analyzing real-world data, this method keeps things clear and consistent — just like good life values.